UNCOVER VALUABLE FLEET INSIGHTS
Get Precision Filtering and Visualization with Pegasus’ Data Analysis
UNDERSTANDING YOUR FLEET’S DATA IS KEY
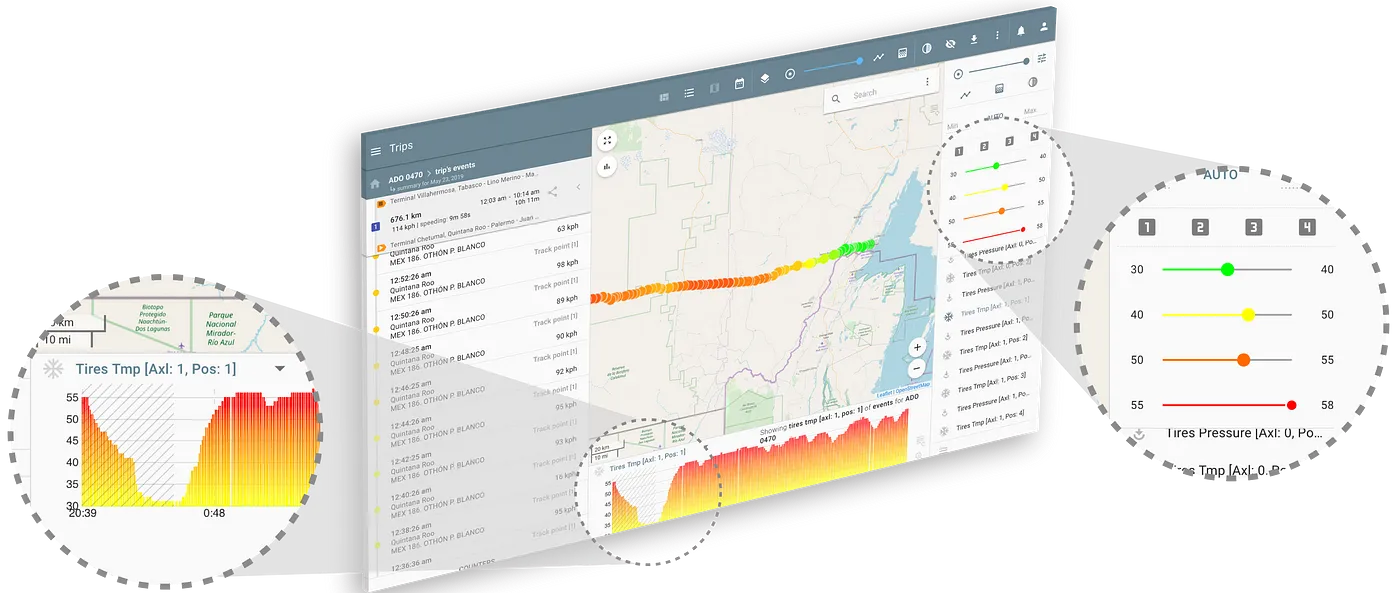
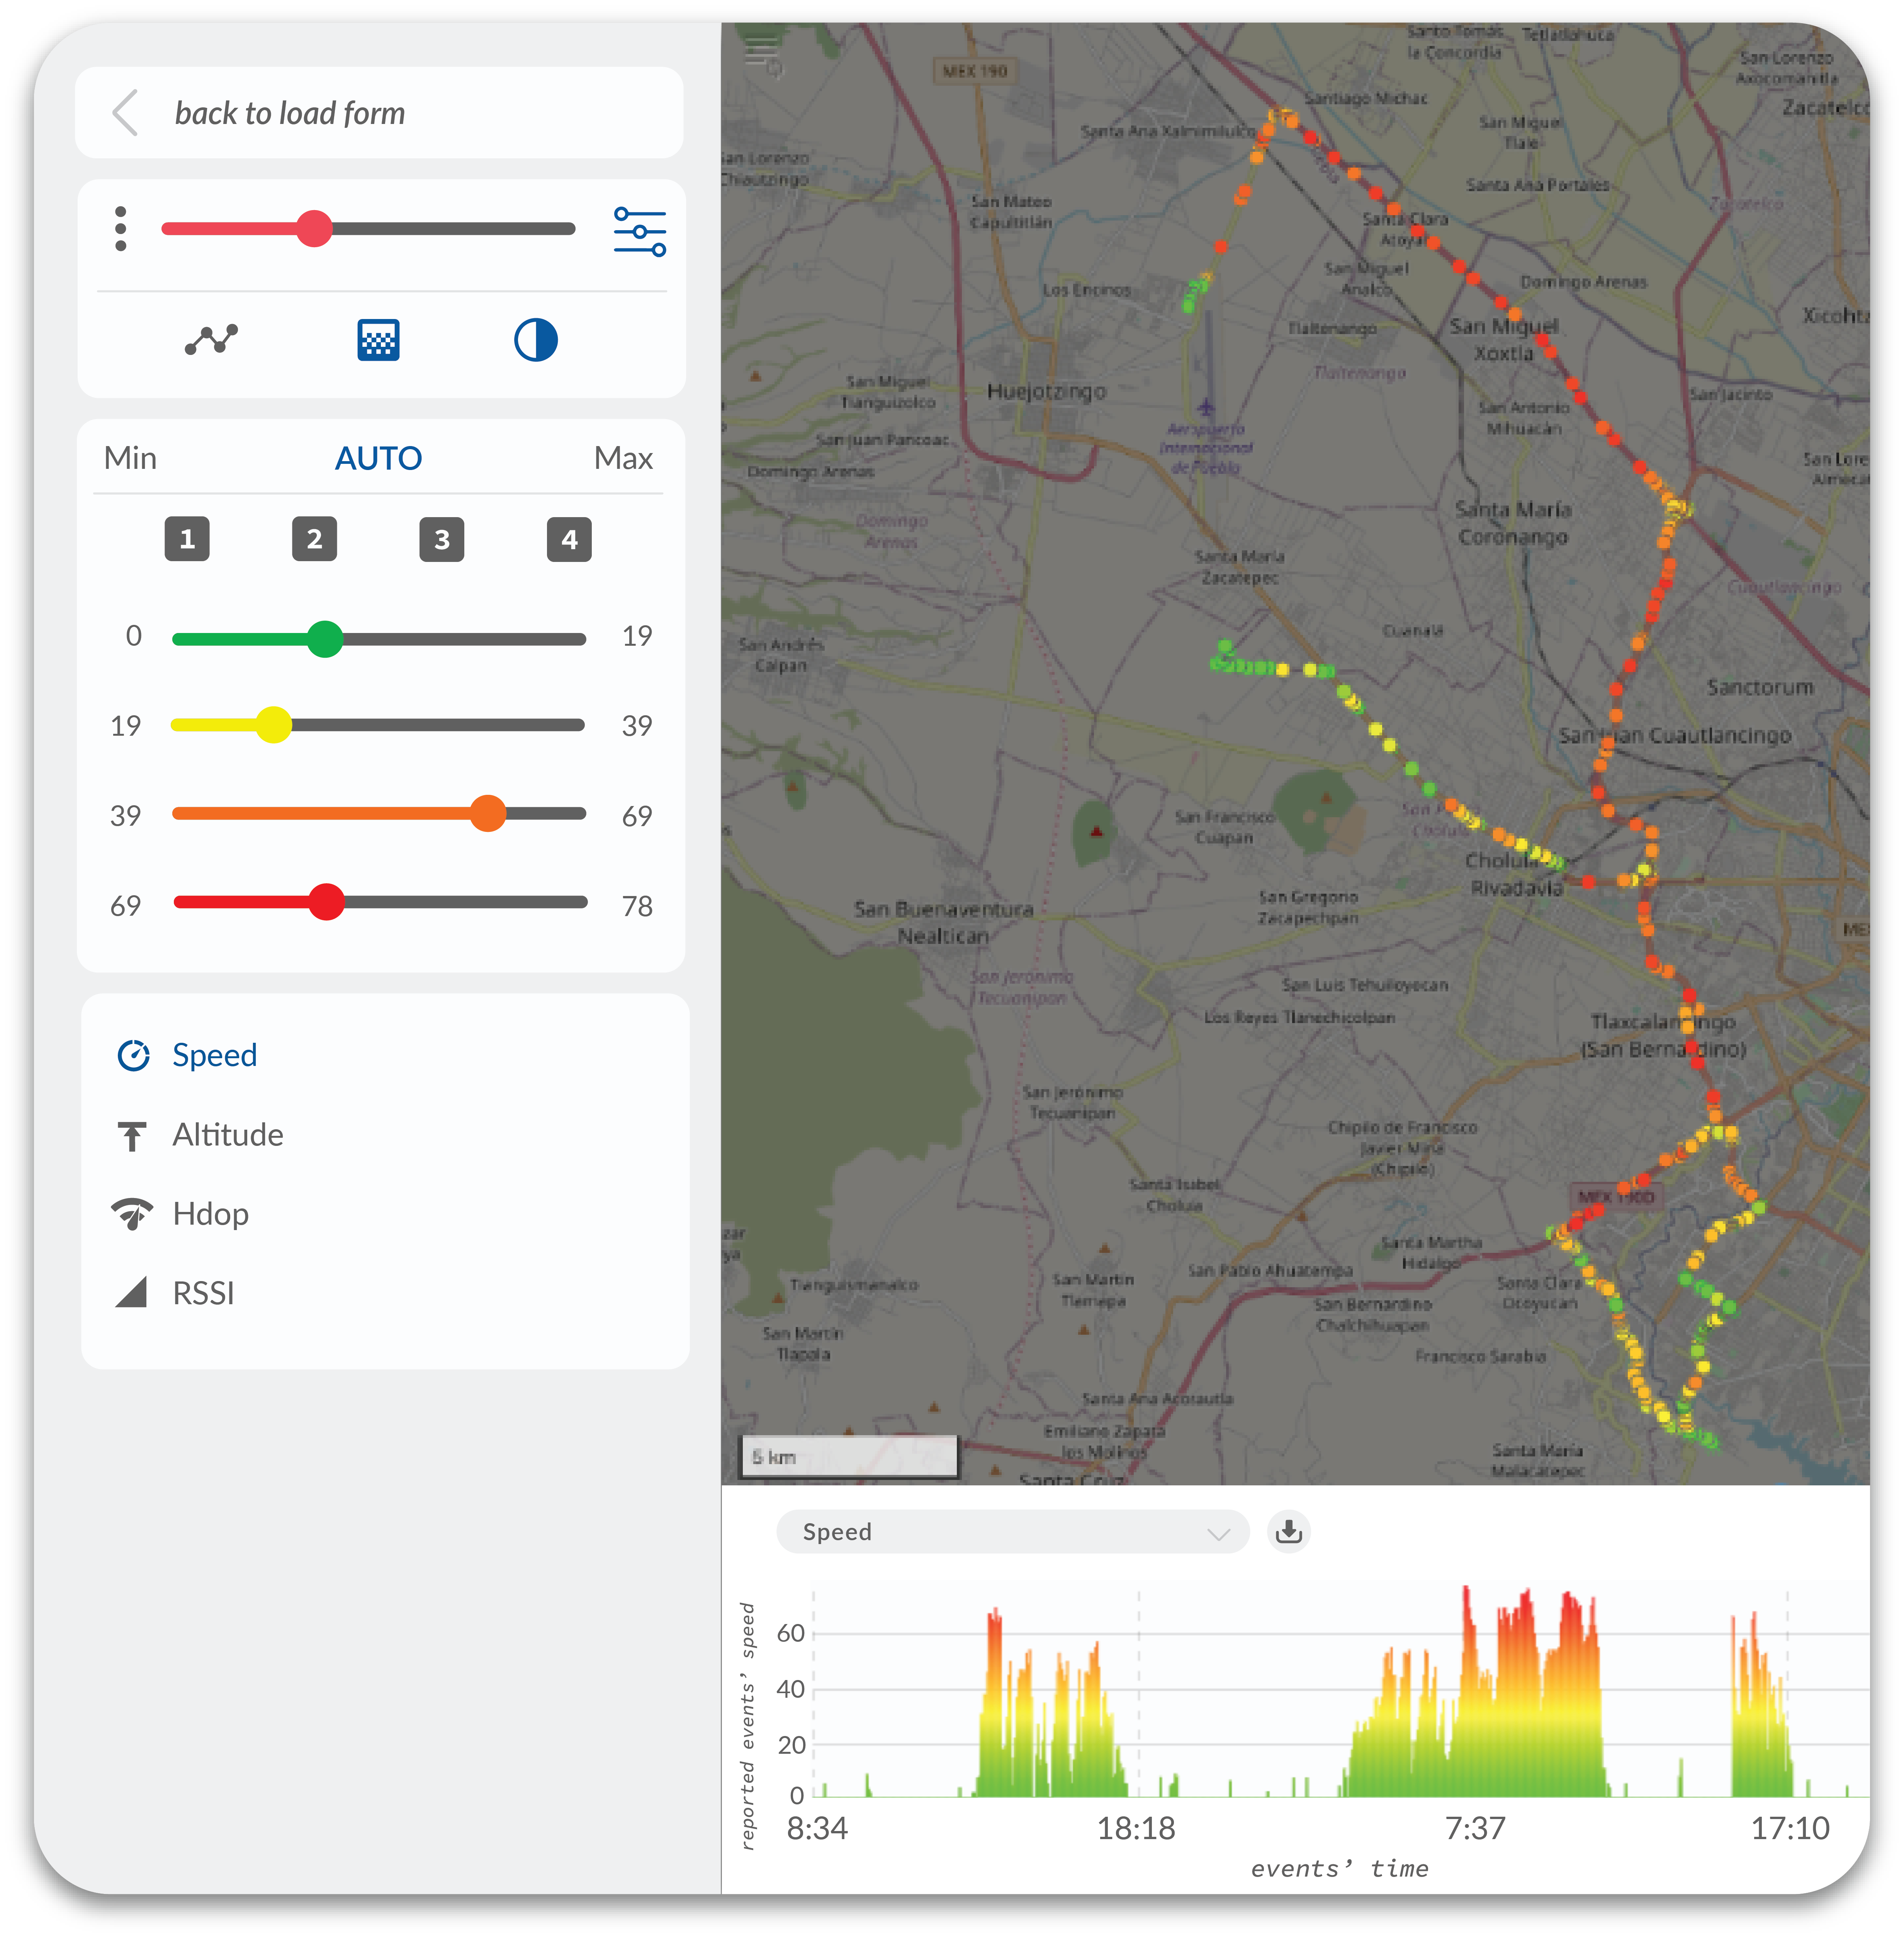
Pegasus’ Data Analysis feature empowers you to sort through and filter critical alerts and conditions generated by your fleet, providing a streamlined approach to information management.
Precision Filtering
Sort and prioritize critical alerts and conditions to enable quick responses to the most important issues.
Easy Visualization
View data on a gradient scale or in heat maps, simplifying complex data sets, facilitating quicker decision-making.
Comprehensive Insights
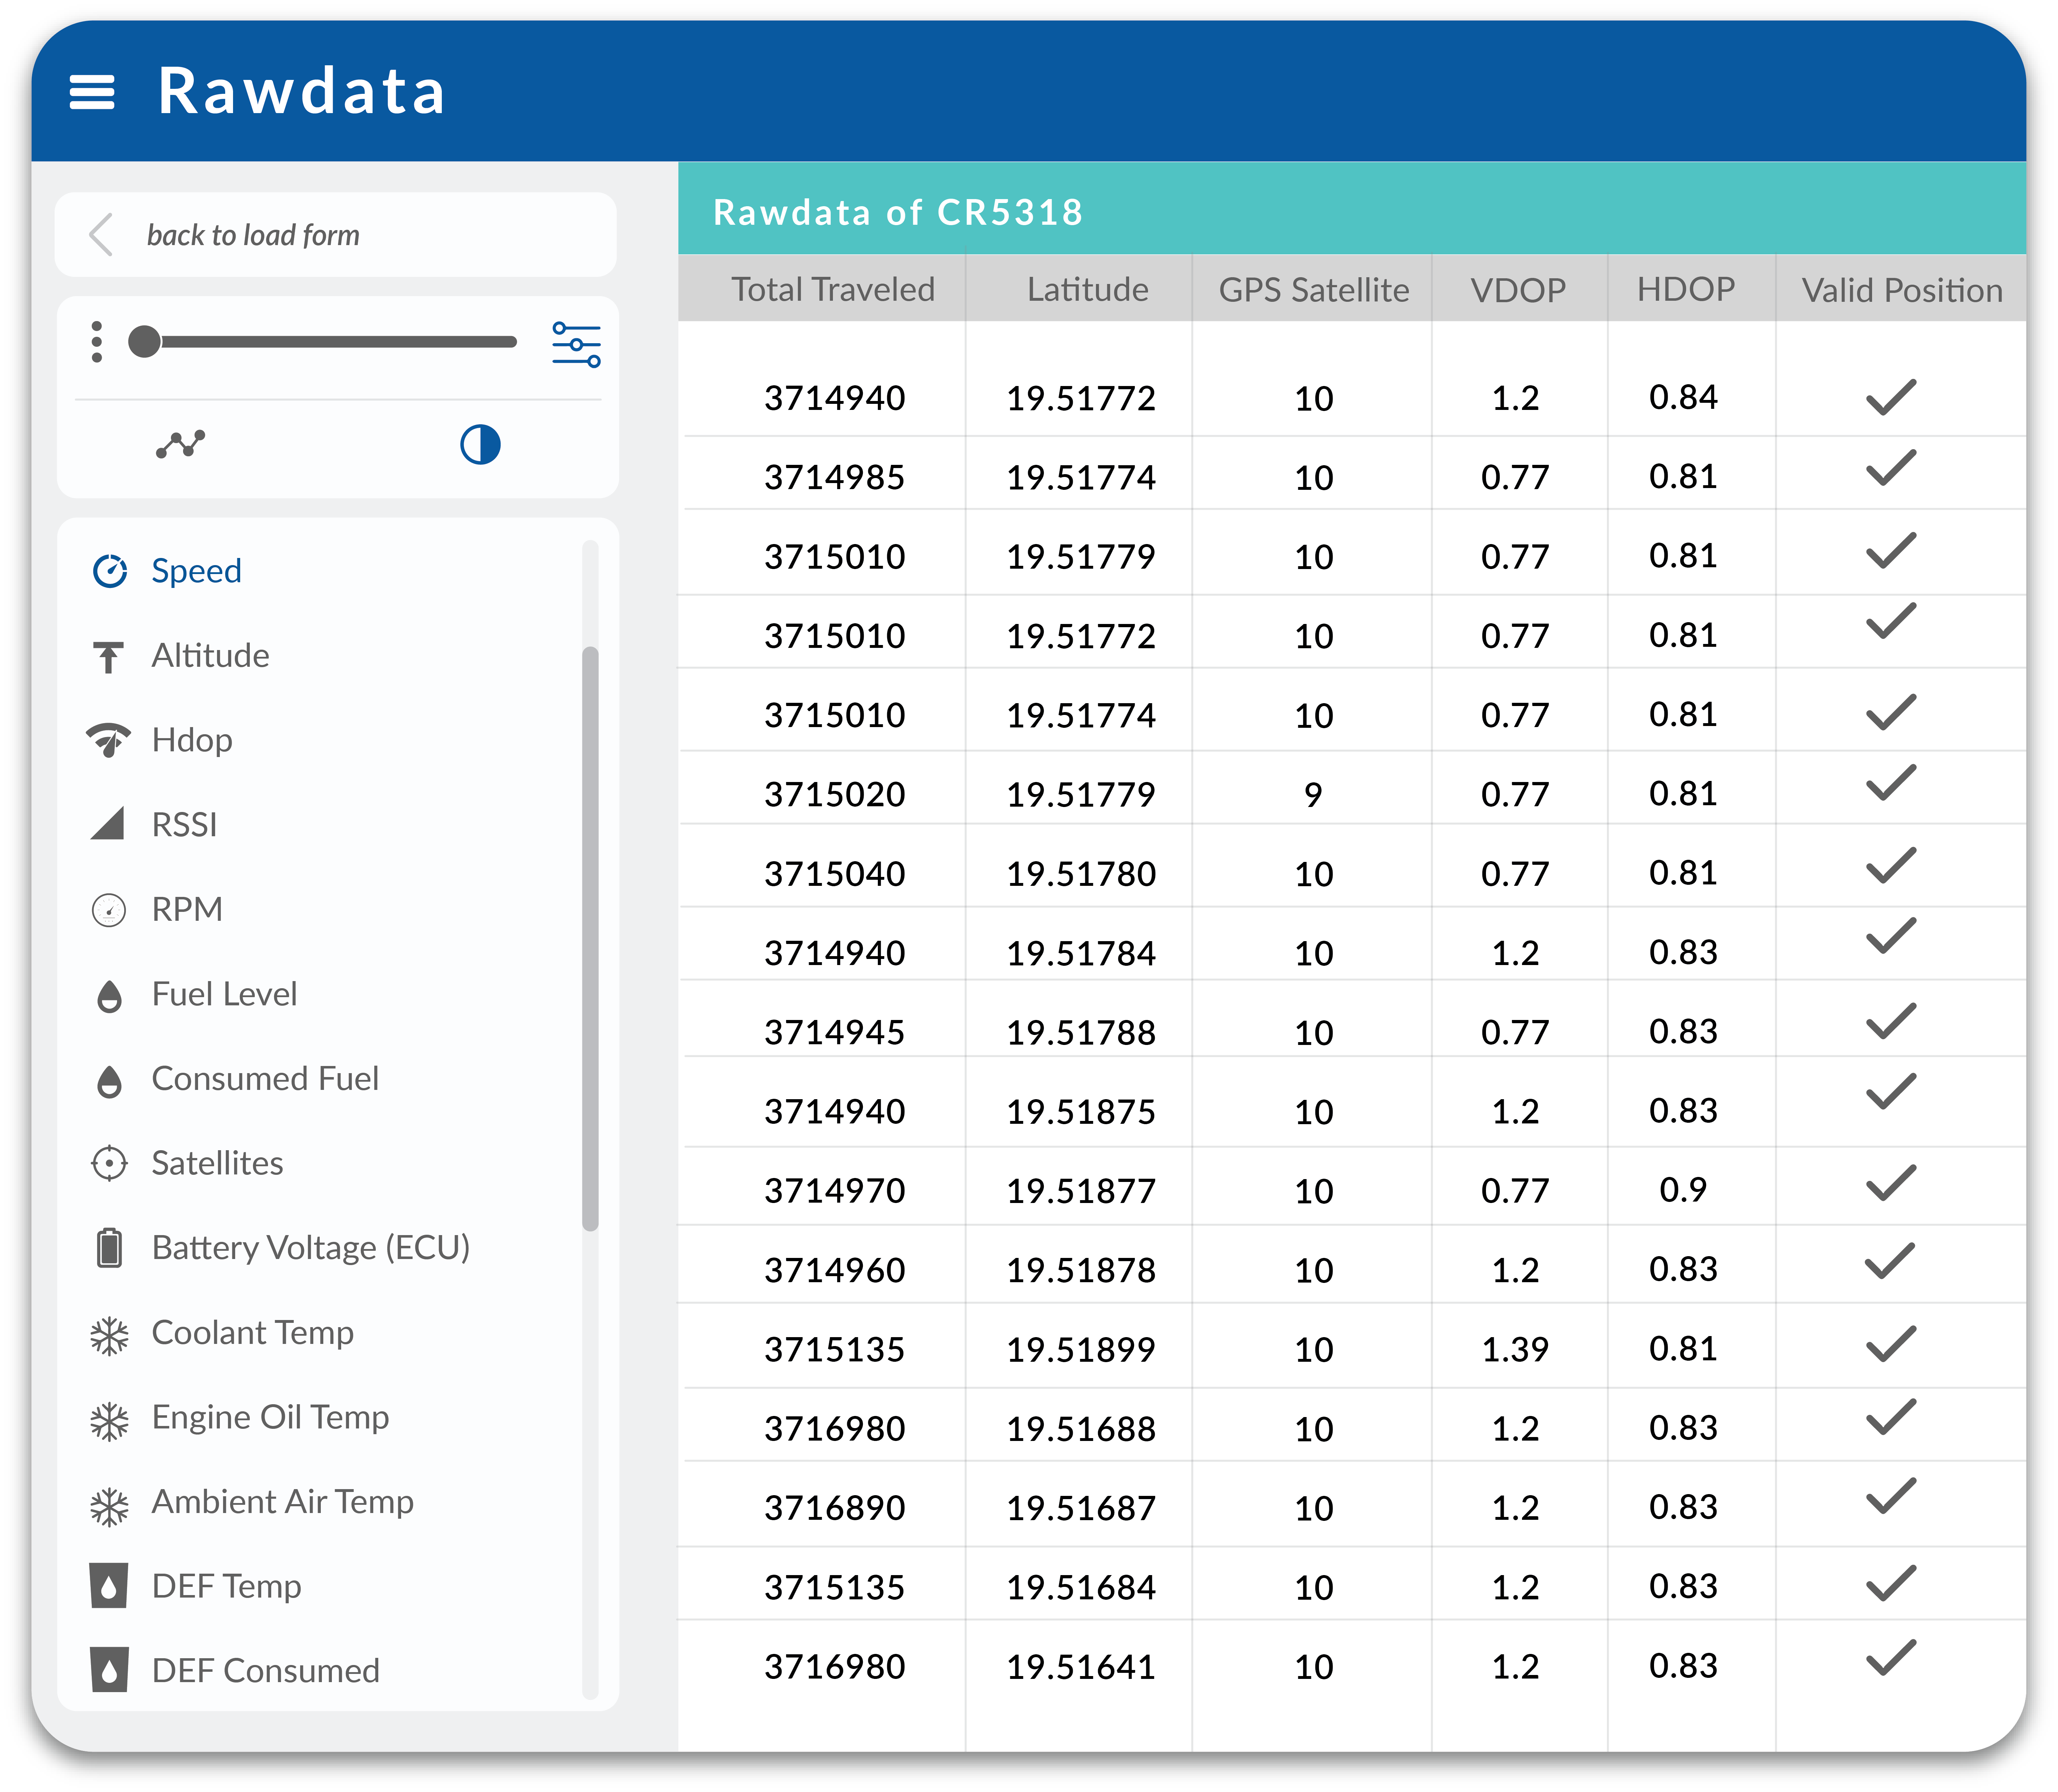
With 500+ parameters available for analysis, gain valuable insights into various aspects of your fleet.
Proactive Decision-Making
Leverage insights to make informed decisions, enhance efficiency, reduce costs, and improve overall performance.
Precision Filtering: Navigate Through the Data Landscape with Ease
Employ precision filtering to navigate the data landscape with unparalleled ease.
This means that critical alerts and conditions are not just presented but are intelligently sorted and prioritized. By fine-tuning the filtering parameters, fleet managers can focus their attention on the most crucial aspects of their fleet operations, ensuring that they can respond promptly to the most pressing issues.